Transportation Dispatch Software
The All-In-One Dispatch Operations Platform
Vantage is a centralized transportation platform that unifies dispatch, load tracking, and driver support into a single, role-based application. I led the end-to-end UI/UX design to give dispatchers, operations teams, and drivers clear visibility into freight while simplifying the workflows they use every day.
From real-time maps to detailed order timelines, this internal platform connects Human Resources, Safety, Sales, and Dispatch teams around the same source of truth — helping them assign loads faster, reduce errors, and support drivers on the road.
| Role | Senior UI/UX Designer · Research → Launch |
|---|---|
| Platform | Enterprise web application · Internal use |
| Teams Served | Dispatch · Operations · Safety · HR · Sales |
| Tooling | Figma · Jira · GA4 · Ride-along research |
Faster load assignment after consolidating tools into a single, role-based dispatch dashboard.
Loads, drivers, tractors, trailers, vendors, and balances surfaced in one interface.
Dispatch, HR, Safety, and Sales aligned around the same live operational data.
Internal system designed to scale with new lanes, fleets, and departments.
Problem & Business Context
Dispatchers and operations teams were juggling multiple tools, spreadsheets, and legacy systems just to understand where freight, tractors, and drivers were at any given moment. Without a shared, real-time view, teams struggled to spot risks early, assign loads efficiently, or support drivers when issues surfaced on the road.
Vantage was designed as a single, scalable dispatch platform that provides a live United States map, centralized load tracking, and role-tailored views so each team can act quickly on the information that matters most.
Strategic Goals
- Unify dispatch, driver, and operations data into one platform.
- Improve visibility into loads, tractors, trailers, and routes across the U.S.
- Streamline daily workflows and reduce manual tool-switching.
- Support role-based dashboards for Dispatch, Safety, HR, and Sales.
Key Application Features
The application combines multiple tools into one experience, supporting dispatchers, driver managers, and back-office teams from first load assignment through delivery.
Live Map & Equipment View
Google Maps–powered live map with overlays for loads, tractors, trailers, and vendors. Filters allow teams to focus on specific lanes, geographies, or at-risk freight.
Order & Route Details
Single-page views show customer data, stops, drivers, equipment, temperature deviations, documents, and conversations in one place, reducing hunt time and confusion.
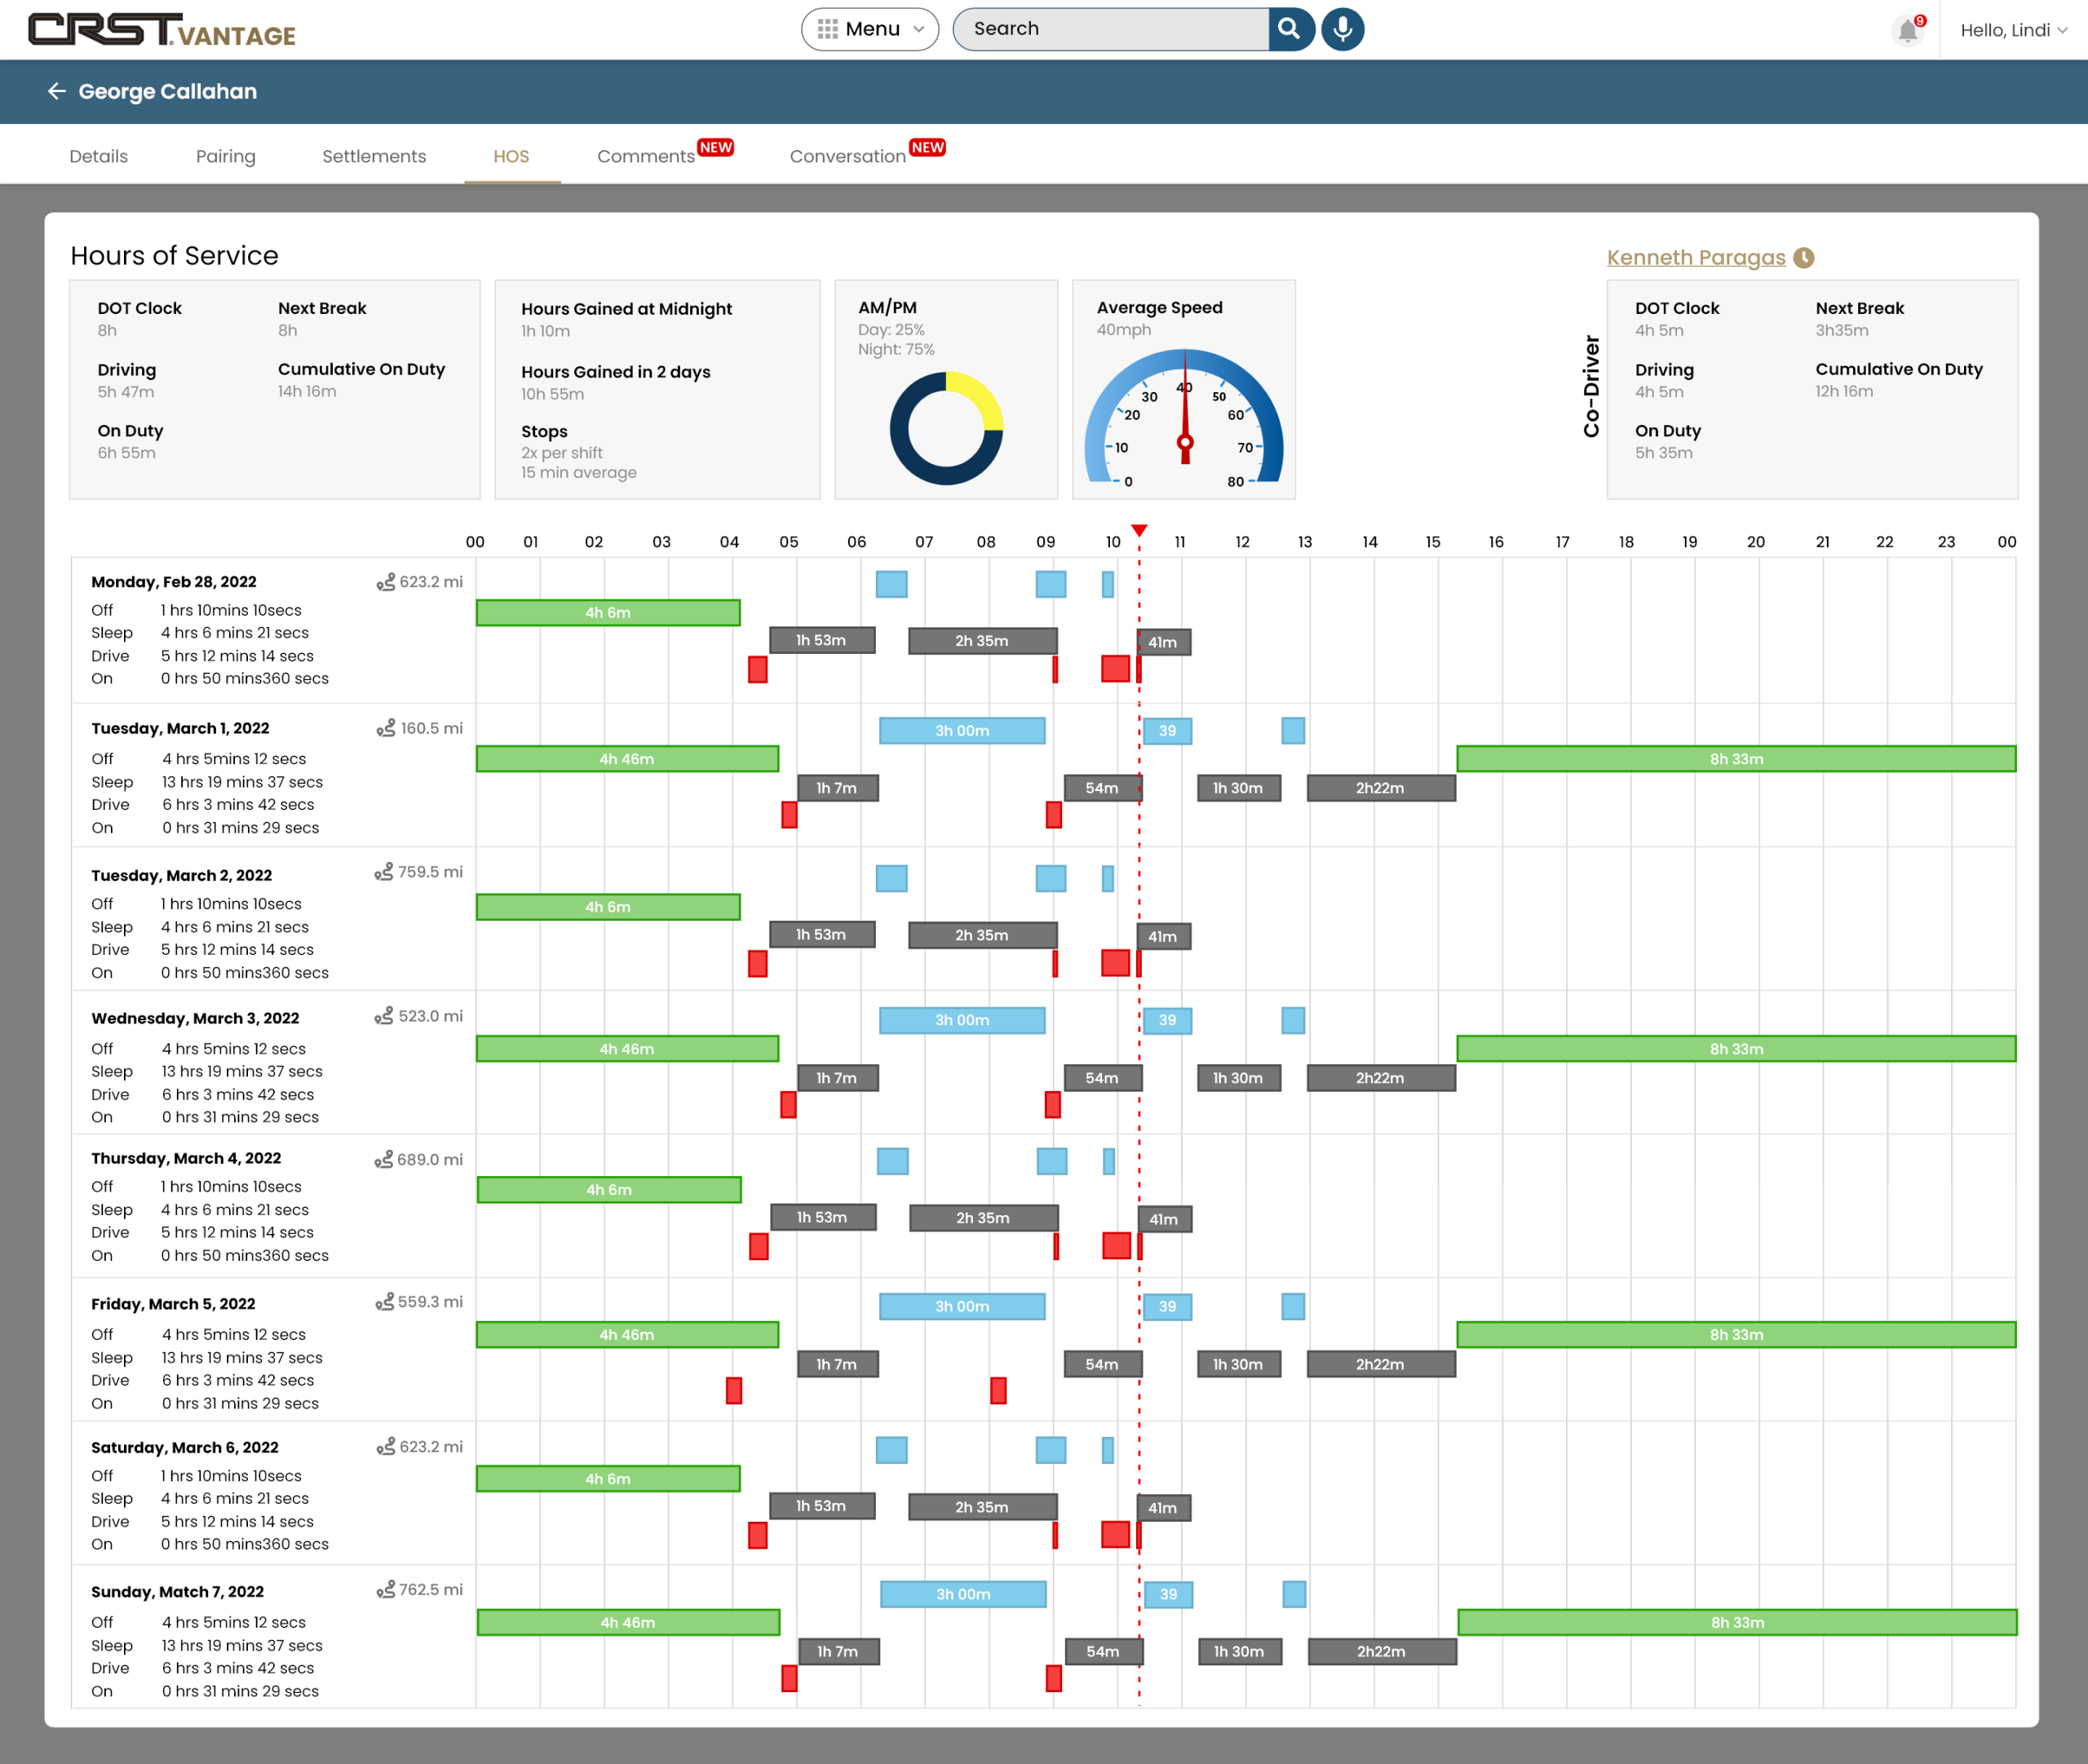
Driver Profiles & Utilization
Driver profiles aggregate assignments, history, hours, and paired drivers, giving Driver Managers real insight into capacity and performance trends.
Document Capture & Storage
Drivers use mobile apps to capture receipts, terminal documentation, and POD images that automatically sync into the dispatch system for faster settlements.
Freight Finder & Assignment
Driver Managers search available freight, match loads to drivers, and send routing details straight to the driver app, reducing delays and back-and-forth calls.
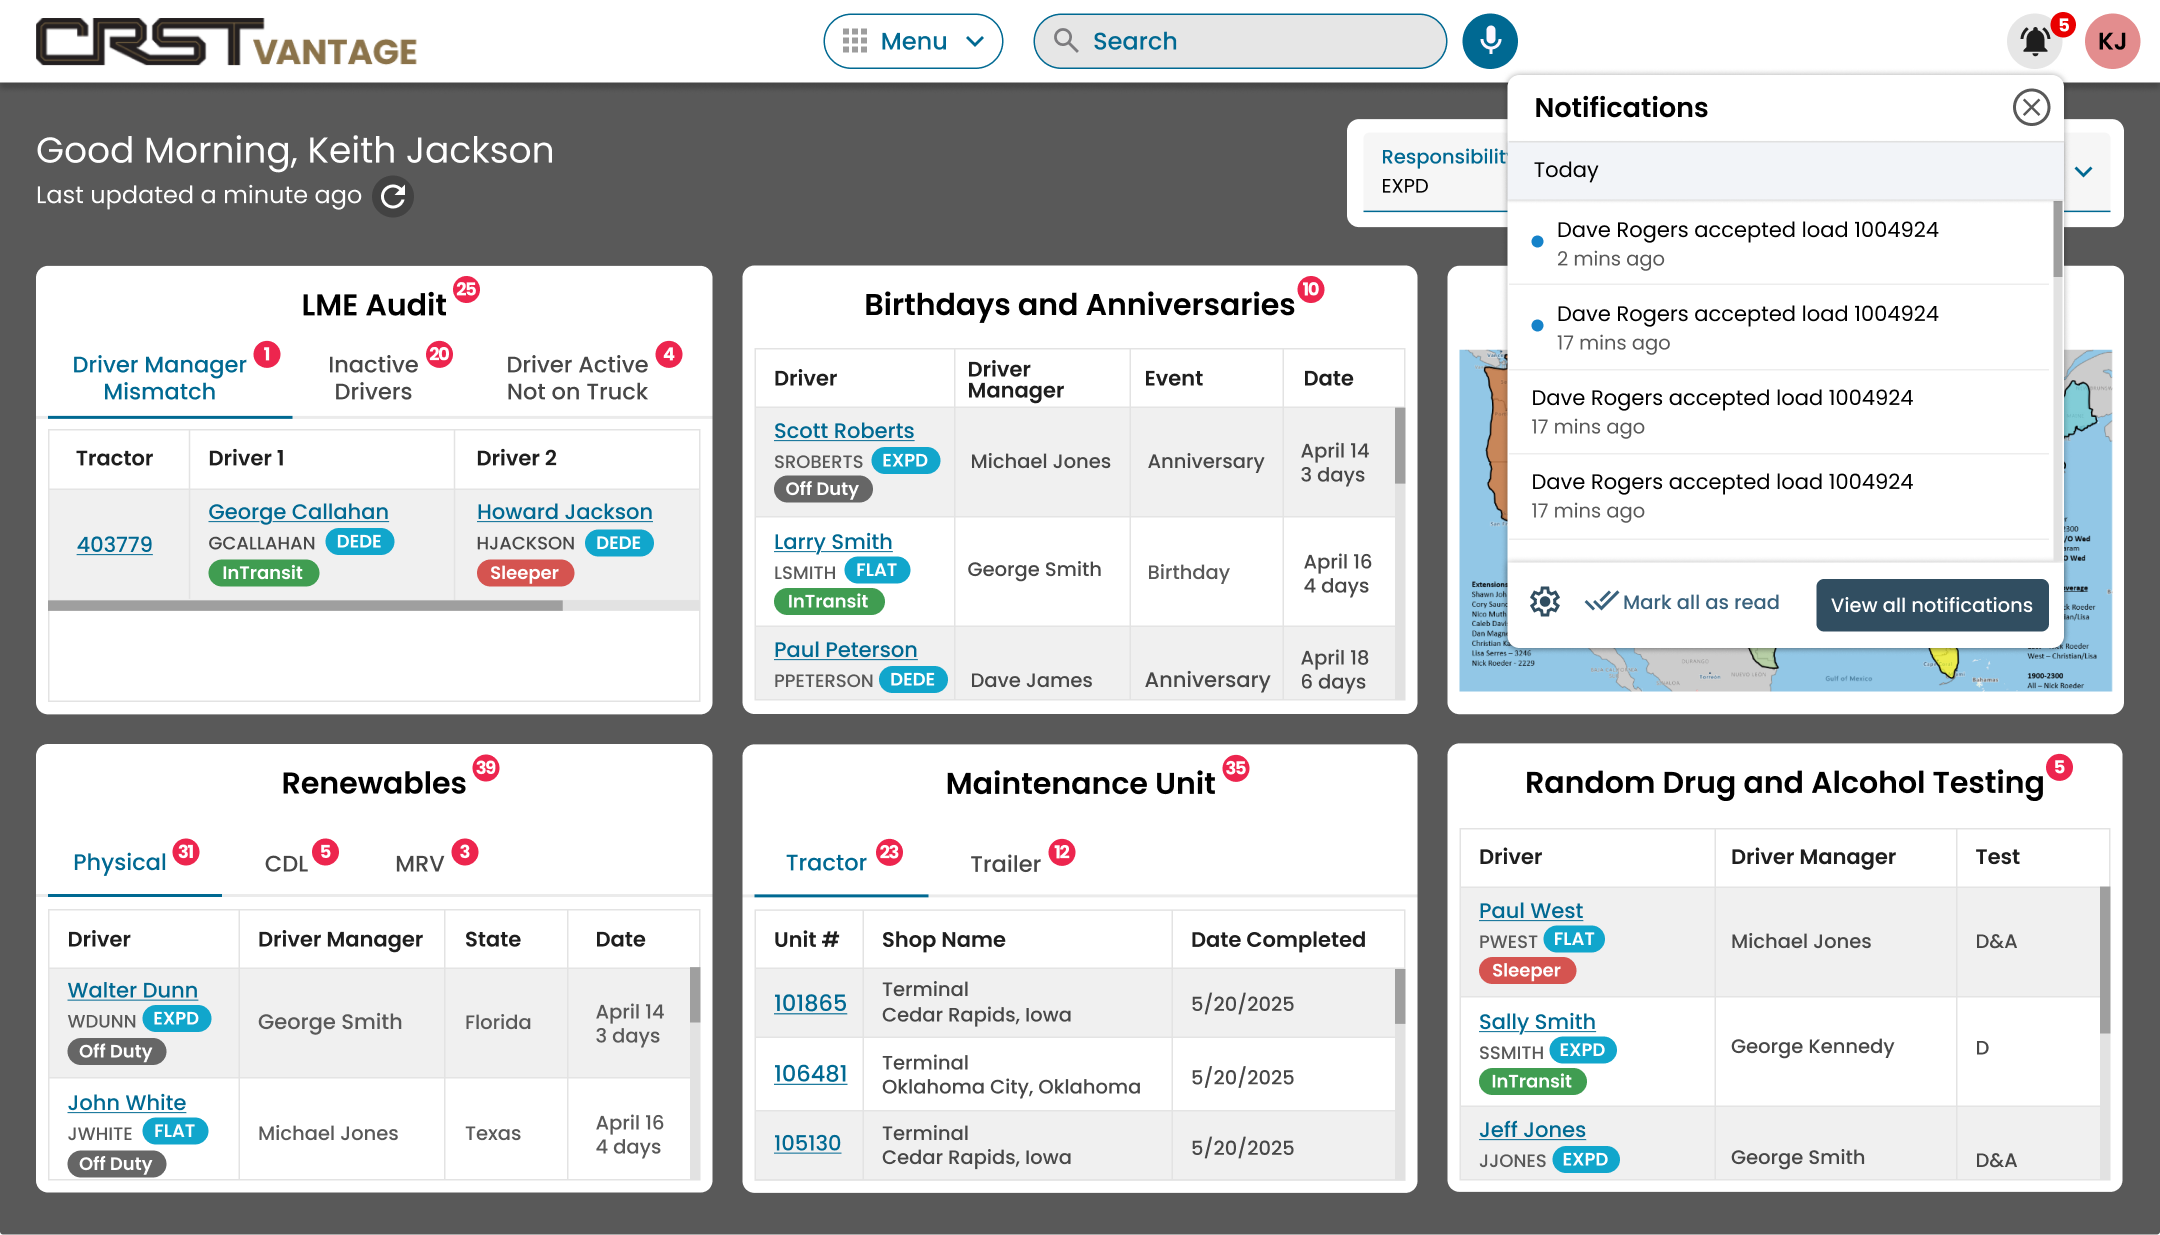
Role-Based Dashboards
Widgets surface the most critical information by role: at-risk loads for Dispatch, incidents for Safety, and utilization and revenue snapshots for leadership.
Key Screens & Interaction Highlights
Each screen balances dense operational data with clear visual hierarchy so dispatchers, Driver Managers, and back-office teams can make decisions quickly without losing context.

UI/UX Journey Map — Dispatch & Drivers
The journey map highlights the end-to-end experience for dispatchers and drivers, the emotions they feel at each stage, and the UX support needed to keep freight moving.
Emotions peak in the Assign and In Transit stages, so UI focuses on visibility, exception handling, and clear communication.
| Step | Stage | Dispatcher Experience | Driver Experience | Emotion | Key UX Support |
|---|---|---|---|---|---|
| 1 | Plan | Reviews demand and capacity via dashboards and live map filters. | Checks assigned loads and ETAs for upcoming shifts. | 🙂 Curious | Capacity widgets and map filters highlight under-utilized equipment and drivers. |
| 2 | Assign | Matches loads to drivers, considering route, hours, and equipment. | Receives new assignment with route, stops, and special instructions. | 😅 Anxious | Conflicts and priority flags appear inline before dispatch finalizes assignments. |
| 3 | In Transit | Monitors loads on the live map and watches exception flags and timelines. | Follows routing, updates status, and messages dispatch as issues arise. | 😬 Stressed | Color-coded states, exception banners, and inline messaging reduce guesswork. |
| 4 | Deliver | Verifies delivery, updates order status, and closes documentation. | Captures PODs and receipts via mobile upload and confirms delivery. | 😌 Relieved | One-tap document capture and clear completion states speed up paperwork. |
| 5 | Reflect | Reviews lane performance, exceptions, and on-time metrics. | Sees completed loads and settlements for better transparency. | 🙂 Confident | Reporting views help managers self-serve insights and refine future planning. |
Journey & Outcomes
The UX process and product decisions are tightly mapped to outcomes for dispatchers, drivers, and the business.
End-to-End UX / UI Process
- Discover: Contextual interviews, dispatch ride-alongs, and system audits to understand real workflows and constraints.
- Define: Journey maps and task flows for assigning loads, monitoring freight, handling exceptions, and closing out trips.
- Design: Role-based dashboards, live map layouts, driver profiles, and modular patterns for cards, tables, and timelines.
- Validate: Interactive prototypes tested with dispatchers and Driver Managers to refine density, labels, and interaction patterns.
- Deliver: Detailed design specs, UI kit, and ongoing design QA during development.
UX Improvements & Business Outcomes
| Area | UX Improvement | Impact | Status |
|---|---|---|---|
| Load Assignment | Unified view for loads, drivers, and availability. | +18% faster assignment; fewer missed opportunities. | In Production |
| Live Visibility | Live map overlays and exception flags. | Earlier detection of at-risk loads and service failures. | In Production |
| Driver Support | Streamlined document capture & messaging. | Reduced phone calls and faster post-trip processing. | |
| Reporting | Foundational dashboards for on-time performance. | Better decisions on lanes, freight mix, and staffing. | Planned |
Results & Impact
Centering the product on real dispatcher behaviors and live operational data delivered meaningful gains in efficiency, visibility, and driver support.
Operational Efficiency
- Unified toolset reduced the number of systems dispatchers needed to monitor.
- Filters and live map overlays accelerated how quickly teams could find answers.
- +18% improvement in load assignment speed after rollout.
Driver & Customer Experience
- Better communication loops reduced back-and-forth phone calls.
- Mobile document capture decreased post-trip paperwork delays.
- More predictable, transparent experience for both drivers and customers.
Scalability & Future Work
- Architecture supports new departments and features over time.
- Usage analytics inform future iterations on reporting and forecasting.
- Foundation set for deeper optimization on lane performance and planning.
Need a portal that ships fast and scales?
I design systems that reduce errors, improve speed, and respect brand integrity.